
SIMM Margin Vs CCP Margin Delivers Unexpected Results
On 9th June, it became clear that the European Union would delay the implementation of the mandatory bilateral margin. See for example the Risk article or the Bloomberg article. But for the rest of the world, the 1 September 2016 date is still a major deadline. The mandatory clearing for vanilla derivatives and the mandatory bilateral margin for all derivatives are part of the same regulatory push to try to overcome some of the banking system’s weaknesses evidenced by the crisis which started in 2007. The mandatory clearing is already effective in the US and was effective in Europe for some users a couple of days ago on 21 June 2016.
The mandatory clearing and bilateral margins are two faces of the same framework, so it makes sense to compare them. Moreover, in their supplementary information on the bilateral margin, the US regulator indicated that such a comparison is appropriate. More exactly in the document
“Margin and Capital Requirements for Covered Swap Entities,” the US agencies indicate (on page 138) that: “In light of the clear competitive forces that will exist between cleared and non-cleared swaps, the Agencies believe that it is appropriate to compare the initial margin requirements of non-cleared swaps to those of similar cleared swaps.”
At OpenGamma, we are ideally positioned to do this comparison. Our solutions allow us to compute initial margin for numerous CCP and bilateral methodologies, including ISDA SIMM (“SIMM”), of which we are an official licensee, using our award winning Margin calculation solution. In this blog, I report some comparisons for single swap portfolios. I take this approach as it helps to identify features of the SIMM model that are not obvious when SIMM is discussed in the context of larger portfolios. Comparing the current initial margin for simple portfolios should only be one step that any financial institution takes in deciding its strategy around derivatives. Many other factors should be taken into account, like the cost of becoming a member of a CCP or a clearing client, the netting effect of central clearing, the type of collateral accepted, the margining transparency, the liquidity difference between bilateral and cleared trades, etc.
Key Findings
By doing this comparison we found that the relation between cleared and bilateral margins is a lot more complex than the often mentioned ‘square root of 2’ ratio, which comes from the ratio between the margin period of risk (MPR) of 10 days for bilateral margins and 5 days for central clearing. We investigated the impact of currency, tenor and notional in order to highlight these complexities.
Tenors
The first set of comparisons are related to a single swap. We compared different CCPs to SIMM:
- The swaps used are IRS v 3M or 6M and OIS; both the payer and receiver (from the point of view of the member) are analyzed
- Due to the simple methodology, the SIMM payer and receiver have the same initial margin
- We selected ATM swaps with tenors between 1Y and 30Y
- The swap currencies are EUR and USD, the notional of the swaps is USD 100m converted in swap currency
- The data used is from the beginning of June 2016
- We compute CCP margin for members; some CCPs charge a higher margin for clients clearing through a broker.
The results for EUR are displayed in Figure 1. The SIMM initial margin numbers are above the CCP numbers even if only slightly above. The minimum requirement for bilateral margins are a Margin Period of Risk (MPR) of 10 days and a 99% VaR. For CCPs, the MPR for swaps is 5 days, but the CCPs use different methodologies, like Expected Shortfall 99.75% with 10 years of historical data, VaR at 99% with 3 years historical data and stress period, or VaR at 99.7% with more than 5 years of historical data. In each of the cases the CCPs use add-ons on top of the base initial margin. Depending on the historical data and the add-ons, there is not a clear order between SIMM and CCPs even if SIMM tends to be above CCP figures. The relation between SIMM and CCPs also change through time.
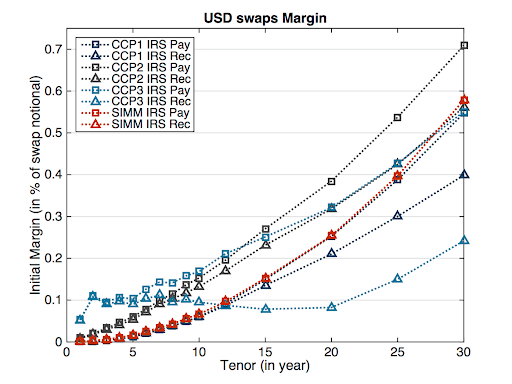
Figure 1: Comparison of initial margin between two CCP and SIMM for EUR IRS and OIS with different tenors.
The results for USD are displayed in Figure 2. In general, the SIMM initial margin numbers are above or in line with the CCP numbers. The results are not as clear as in the EUR case. The reason for this is probably due to the SIMM methodology. In SIMM, the same risk weights multiplier to basis point sensitivities are used for all main currencies. The EUR rates are lower and thus the sensitivity for one basis point are higher for the same notional. This explains why the SIMM numbers for USD are below the numbers for EUR.
Also note that for long-term swaps, the schedule based approach provides numbers below both SIMM or CCPs. However, this is largely irrelevant for larger banks; using the schedule has been ruled out for their interbank exposure as it does not offer any netting benefits between trades.
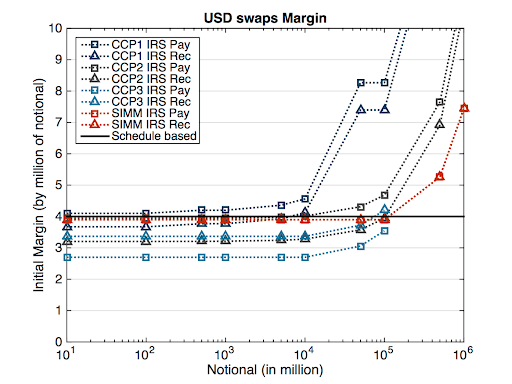
Figure 2: Comparison of initial margin between some CCPs and SIMM for USD IRS and OIS with different tenors.
Fixed Rates
In the second set of comparisons, we look at 10Y swaps with different fixed rates. The results are displayed in Figure 3. The ATM swaps have a PV and thus a currency exposure of 0. Due to the different way the CCPs treat currency exposure, the profiles, which represent swaps with non-zero currency exposure, can be quite different. For SIMM, the profile depends on the base currency; here we have selected EUR. The currency risk is taken into account for the initial margin computation. Here we selected JPY for the swap because it is not the base currency for any of the initial margin methodologies analysed.
Figure 3: Comparison of initial margin between some CCPs and SIMM for JPY IRS and OIS with different fixed rates.
In general, the initial margin for JPY swap is lower than the one for USD and EUR. This is due to lower volatility for JPY historical data used by CCPs and is recognised by SIMM which has a special low risk weight for JPY. The interesting feature of that graph is the shape of the profiles. The ‘blue’ CCP does not include the currency exposure of the trade in the initial margin computation; the initial margin graph is roughly shaped like a line. The graph for SIMM looks more like a ‘smile’. This is due to the interaction/correlation between the interest risk and the currency risk. As the ‘green’ CCP and our SIMM implementation have base currencies different from the CCP base currency and take the currency exposure into account, the graph shapes are different, but both of them are convex curves and not lines.
Non-Linear Behaviour
In the last comparison for this blog, we take a 10Y ATM swap in USD and check the initial margin for different notionals. As a first approximation, we can think that the initial margin is linear in the notional and this comparison does not bring more information than the one presented in the first test. But all CCP methodologies have some kind of add-on which are not linear in the size; the initial margin increases faster than the notional. This is particularly true for the ‘liquidity add-ons’. It is interesting to check from which size the CCPs are becoming more expensive in terms of margin than a bilateral initial margin. Note that SIMM has some provision for a “concentration risk” (CR) which would make SIMM also not linear in the size, but for the moment the CR threshold is undefined and the method is still linear in the size. The results are presented in Figure 4.

Figure 4: Comparison of initial margin between some CCPs and SIMM for USD IRS and OIS with different notionals.
Figure 4 presents the results with a log-scale for the notional and a linear scale for the ratio between CCP and SIMM. For all CCPs, above a certain notional, the initial margin is larger than SIMM. For this example with only one 10Y USD swap, the notional where the non-linearity kicks in is around 10 billions. The ratio can be above 2 for large amounts. For more complex portfolios, especially when the overall risk is small and there are large offsets between different maturities, the ratio can be even larger.
Conclusion
The comparison between CCP’s initial margin and bilateral initial margin (represented here by SIMM) for swaps is not a straightforward task. Even for a single swap, there is a diversity of results depending on side, currency, rate, notional and the date the analysis is run. In most cases, SIMM is above CCP figures, but this is not always the case. Portfolio effects and add-on bring even more complexity to the process, but this will be the subject of another blog.
The detailed analysis of these issues requires not only the tool to run the computation for the different CCPs and bilateral margining in parallel but also a continuous monitoring of the data used.
Please contact us for more details on the results presented in this study or information on our margin calculation offering, which was used for this study and is used by market participants to perform similar analyses.