I have previously written about how the majority of CCPs are using Filtered Historical VaR as the basis of their margin algorithms, usually alongside stress or unfiltered scenarios to avoid procyclicality.
But the algorithms of the main CCPs also have something else in common: liquidity add-on. This can be a significant component of the margin for large positions, so it’s important to understand how it is calculated – and how the methodologies compare – when considering your choice of CCP.
How Is The Liquidity Add-on Calculated?
Let’s look at the liquidity add-ons of the four major swaps clearing houses: CME, Eurex, JSCC and LCH. At the core of each of these calculations is an attempt to estimate the additional cost beyond the standard market moves covered by the market risk component of the margin algorithm, of hedging or closing out a defaulting member position. And the larger the position the larger these costs are expected to be.
Each CCP will have its own way of determining ‘large’: looking at their own open interest and the depth of the market in general. They will also have different views of the likely spreads when trading the hedges.
Let’s look at each of the algorithms in a bit more detail:
CCP 1
A par rate delta ladder is calculated, bucketed by key tenor points. A hedge portfolio is then determined against these sensitivities.
The notional of this hedge relative to the market is then used to look up an implied spread.
CCP 2
A hedge portfolio is determined based on swaps with standard maturities across the different curves and currencies.
The sensitivities are multiplied by a bid/ask spread to cover the risk of spreads in the market when hedging a defaulting member portfolio. To cover additional market moves that may occur when hedging a large portfolio, the market risk (VaR) of the hedge portfolio is multiplied by a liquidity factor determined based on the relative size of the swap to the CCP view of market capacity.
CCP 3
First a hedge portfolio, expressed as a series of sensitivities, is determined based on standard curves and tenors.
For each hedge, a charge is applied based on the sensitivity above a threshold. A discount is then applied to this charge based on correlations between the tenors of each curve.
CCP 4
A delta ladder for the portfolio is produced based on basis, discount and forward curves. These sensitivities are then aggregated across the curves to obtain a total delta for the currency.
The total delta is then multiplied by a liquidity factor, the size of which is based on the level of the delta.
How Do the Numbers Compare?
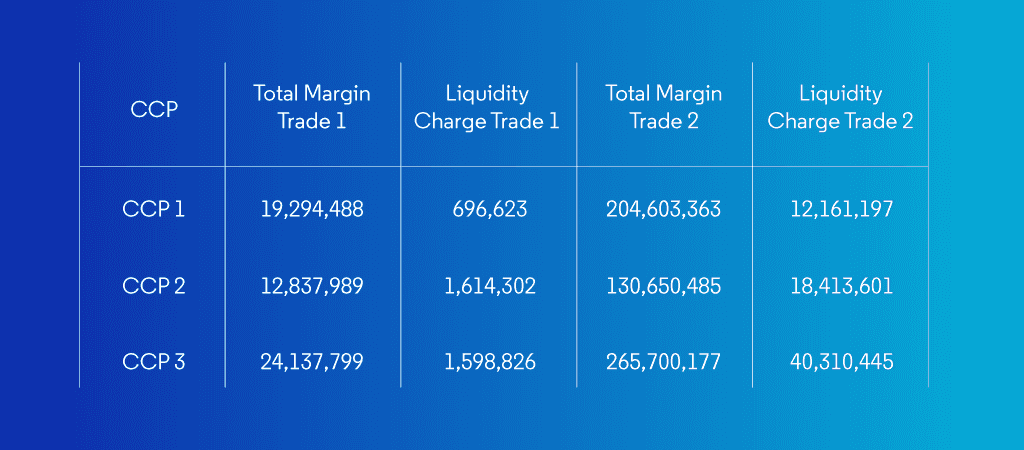
It’s ok to compare how the different CCPs calculate the liquidity, but the most important question is: what is the impact on margin? To compare them we need to consider a trade that can be cleared at all of the CCPS. And this will need to be a big trade to make sure that the liquidity charge kicks in. Let’s consider the following trades:
Trade 1 – 20 year EUR 300 Million Pay 6M Euribor v 2% fixed.
Trade 2 – 20 year EUR 3,000 Million Pay 6M Euribor v 2% fixed.
Margin Comparison
The following table shows the liquidity charge for 3 CCPs:


