Normalising broker data is an essential first step in treasury automation.
There are lots of use cases that a treasury automation system needs to support; margin validation, exception management, limit monitoring, collateral and payments. But none of these are possible without having the correct data available.
This is where data normalisation comes in. You can’t validate margin for example unless you are comparing like for like. The margin needs to be calculated on the same positions, at the same level and using the same parameters. This is only possible if the inputs from various sources are all mapped correctly.
This sounds simple, but actually can be the most complex part of any treasury automation solution. So why is data normalisation so difficult?
Data Formats
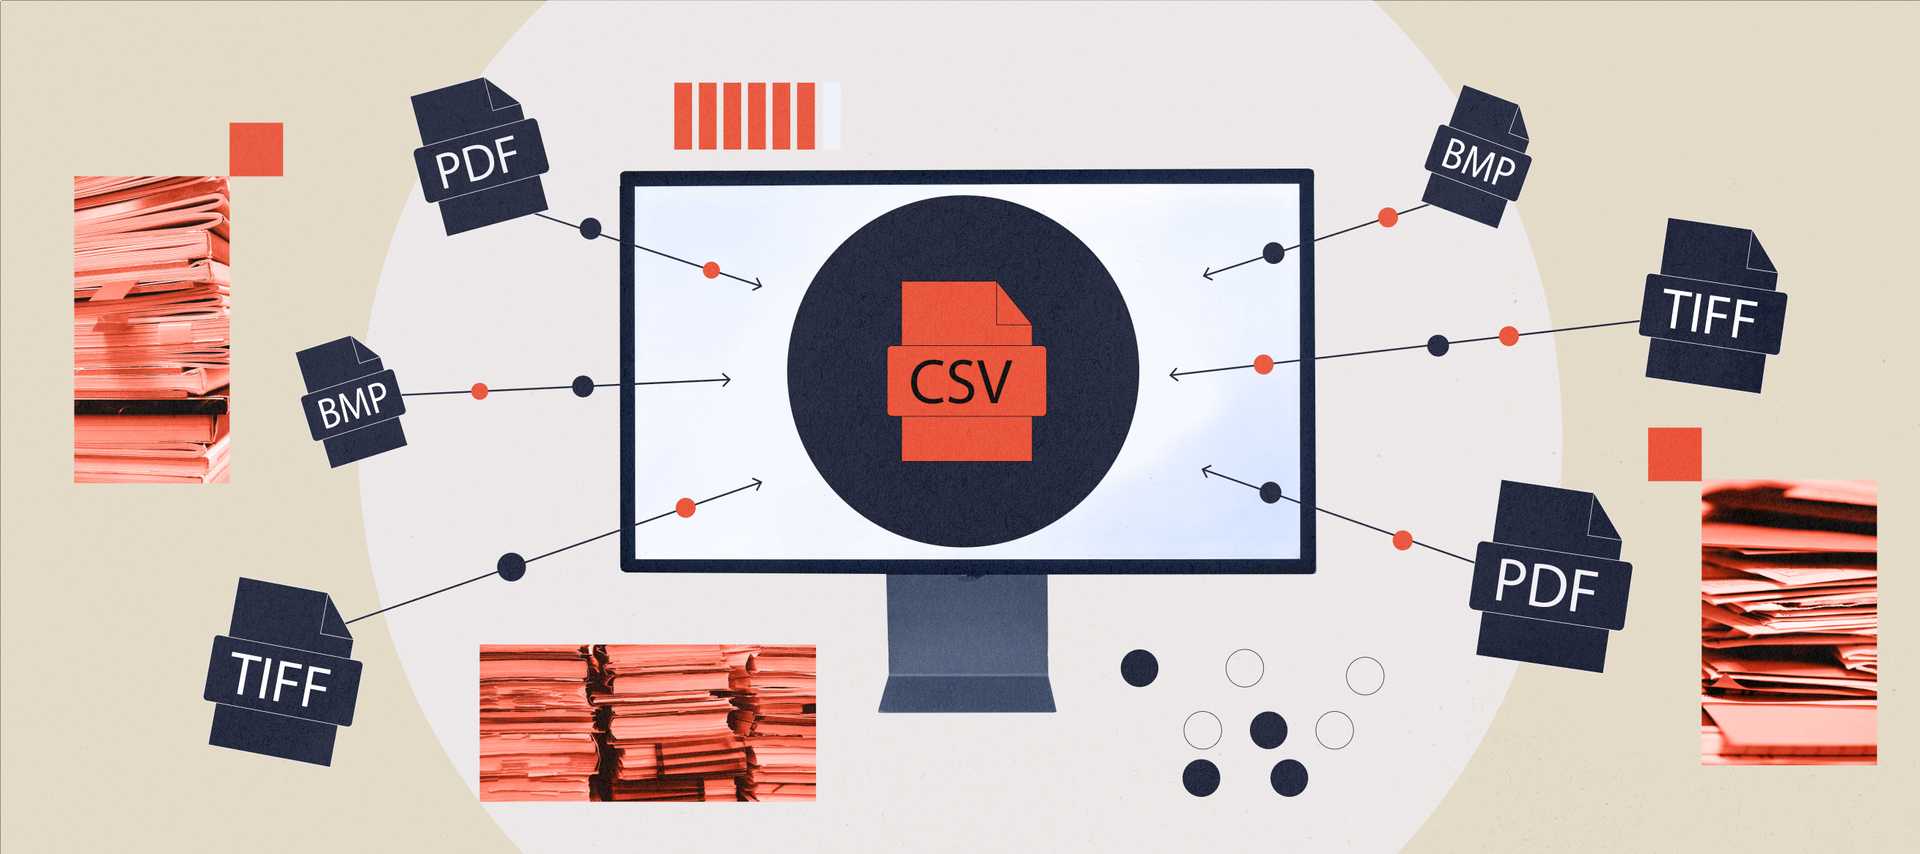
The first issue is a technical one. The way that the data required to support treasury automation is supplied can have many sources and take many forms. Internal data, broker reports, feeds from banks and custodians, and potentially information from exchanges and CCPs all need to be normalised. And this means support for multiple physical formats.
Some reports will only be available in PDF format, although if you are lucky text or CSV versions may also be possible. Much of the data, such as feeds from CCPs, will be in their own bespoke format. Other information will be available via standard messaging formats such as fixML and Swift.
Some of these formats are easier to process than others. Things such as PDF or text based reports which are easy to read can be very difficult to integrate within an automated solution. What is required is a system that can accept all of the different formats and convert them into machine readable data.
Different Name Same Data
Being able to read the different data formats is only half of the problem. The next step is mapping this to a set of standard variables and values.
Common concepts can have multiple names. Option Value is one of the most obvious examples. It can also be called Net Liquidating Value or NLV, Net Option Value or NOV, or Option Premium, or Premium Value. All of these need to be normalised to the same thing.
Then there are the names or codes used for key pieces of information. ETD contract codes are items of data that can follow many different schemes. Examples include Bloomberg tickers, exchange or trading codes, clearing codes (which for some CCPs are the same as the exchange code but can be different) and back office system codes, for example the GMI specific naming scheme.
The way that the contract details are provided can also vary. For example the expiry may be provided as a Bloomberg month and year code. Alternatively it may be an actual date, but that could be in any of the possible date formats, for example yy/mm/dd or xx-mmm-yyyy. Other parts of the contract details can also be a challenge to interpret. For example, different scaling can be used on strike prices, so for a STIR contract values of 98.375 and 98375 would imply the same contract.
Even simple things like exchange names can vary, often based on the history of the market. Looking at the data provided from various sources, you would be forgiven for thinking that the trading of commodity contracts such as cocoa and sugar in London occurs across multiple markets. Over time the name of this market has changed from Fox to The London Commodity Exchange to Liffe Commodities and finally to ICE Commodities. This has an impact on the exchange code provided in different input files. FOX, X, LCE and IFLX, as well as the historic full name of the exchange, are all examples that we have seen in client data.
The key here is the expertise of the analysts in understanding the input, identifying which report holds the required information and how each report should be interpreted. This then needs to be translated into a technical representation of the data that can be used to support the multiple use cases that form part of a treasury automation system.
Level and Scale
Being able to read individual reports and to accurately interpret the data within them isn’t the final step of data normalisation. The data then needs to be aggregated to the appropriate level. For example, the data from internal sources may be by trader or fund, but broker reports are potentially for the whole firm. In general, validation will be conducted at a total level, but if a break occurs, then a breakdown will be required to identify and understand what is causing the issue. The data needs to be normalised at multiple levels, adding to the complexity of the task.
The scale of the data normalisation problem also needs to be considered. There are multiple dimensions; brokers, exchanges and CCPs, products, margin algorithms with different components, collateral types and depository systems. This is a lot of data to be normalised, and requires a deep understanding of the markets to be able to do this successfully across all the different inputs.
Conclusion
A combination of technical and business domain expertise is required to normalise data and provide an easily consumed and comparable format as the basis for treasury automation. Using a third party provider will mean that they take responsibility for understanding the different formats, transforming the data and keeping the solution up to date as new requirements emerge.


